Gain insights or add structure—in real-time
Collect process data from people, devices, machines, and systems in your operation and standardize it into dashboards for more informed decision-making.
-
Real-time visibility
Collect production data, and calculate KPIs across your facility.
-
Configure data models
Build flexible databases for endless use cases—without coding experience.
-
Powerful reporting
See defect rates, production targets, machine data, and more.
Create custom databases in Tulip without code
The use cases for Tables are endless - track material inventory, SKUs, defects, work orders, bills of materials, skills, tools, and material properties.
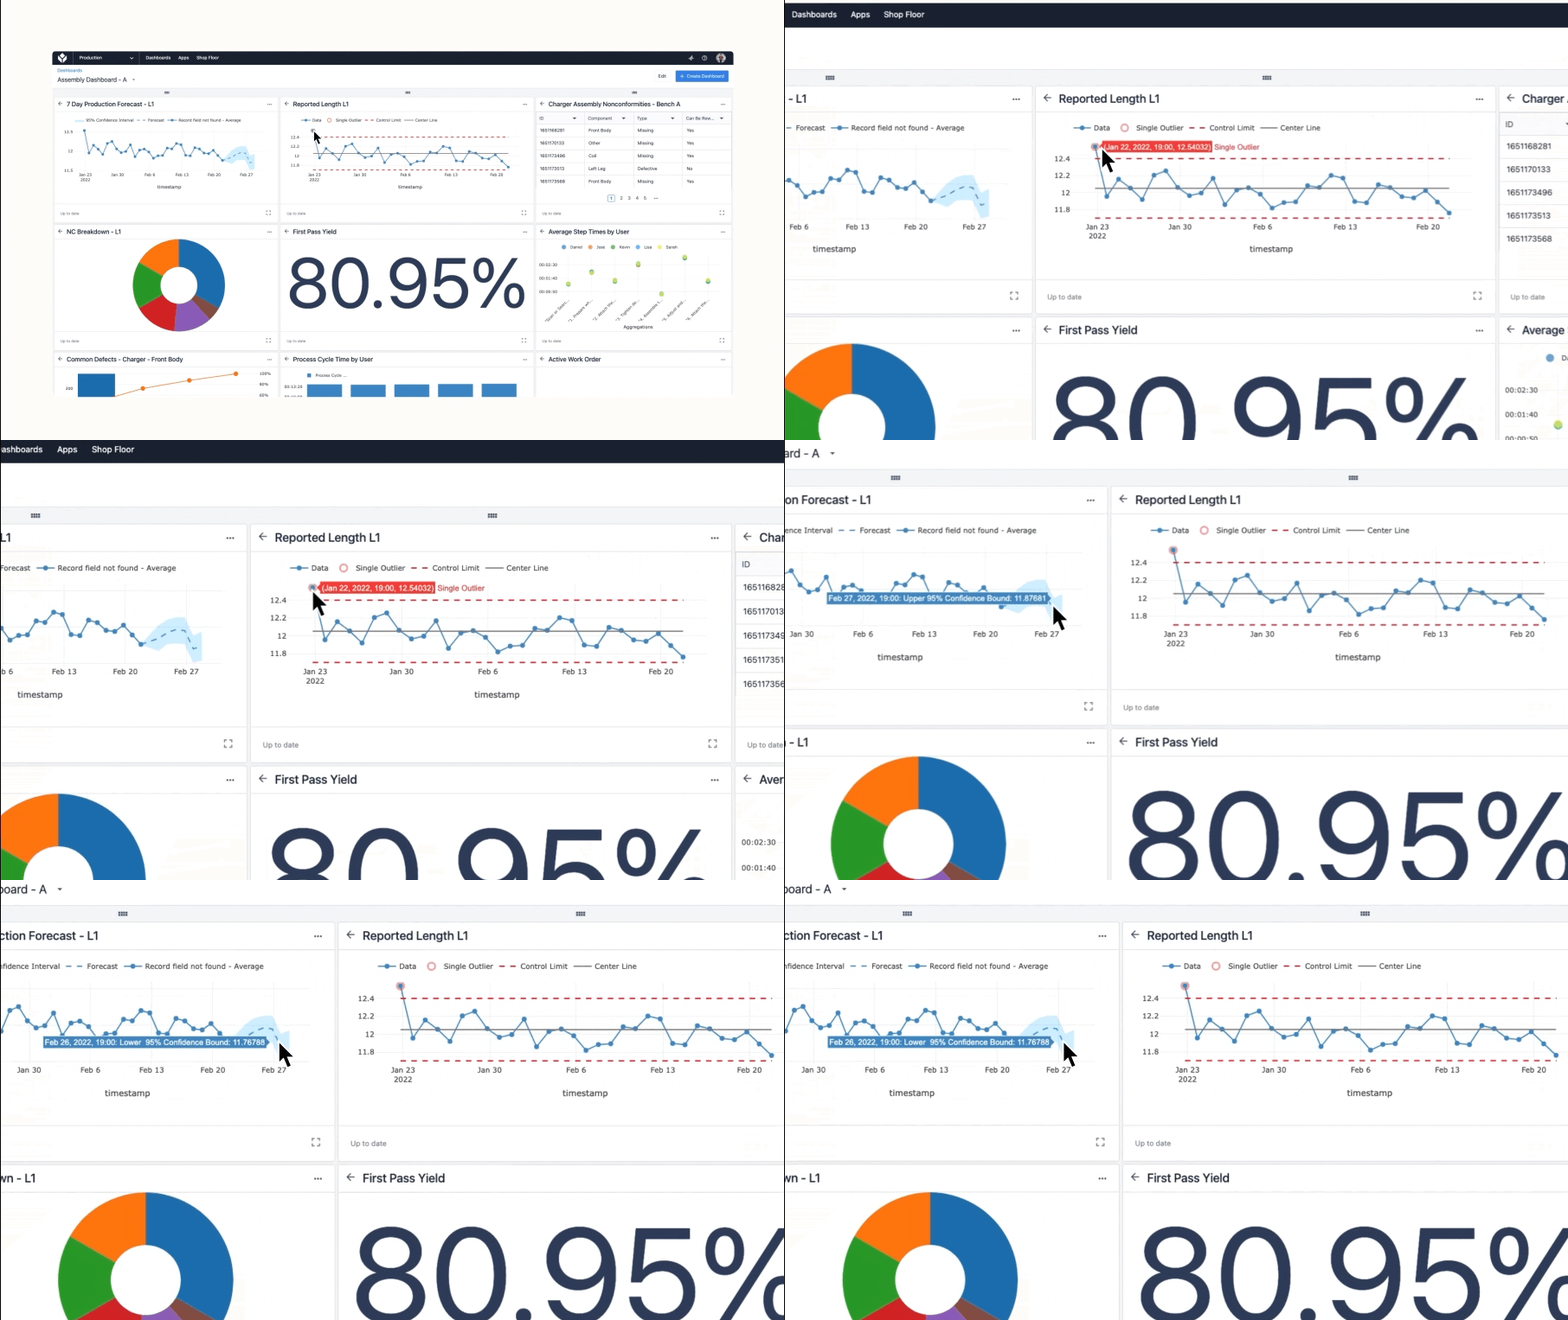
Create dashboards, where you need them with no-code
Build powerful dashboards to display anywhere in your operation. Track specific metrics, and visualize your data in apps or on a global dashboard.
Unlock powerful insights from your data
Augment frontline knowledge with powerful chart layers built for operations to eliminate the need for external BI tools and use your data more effectively.

-
Control charts
Ensure process performance, product quality, and operational consistency.
-
Native alerting
Be alerted to outliers and shifts in your data as they occur to address problems quickly.
-
Machine learning forecasts
Harness the power of native ML models for your data to support your decision-making.
Create your own composable data structure
Utilize Tables, Queries, and Variables to create common data models that allow apps and systems to share data across your entire production. Track material inventory, SKUs, work orders, BOMs, and more.
"[Tulip application data from all of our factories] goes into our data lake for our entire global ecosystem. We are able to marry that data, regardless of where it comes from, into all of the operational KPIs that our leaders need to see."
Audra Kirkland, Director of Digital Manufacturing, Terex Corporation
Hear how Terex uses Tulip to improve quality with real-time data →
Support compliance initiatives with digital history records and batch tracking
Companies in regulated industries rely on Tulip’s record history capabilities to streamline documentation for digital logbooks, machine monitoring, and audit records.
Digitally transform your operations with Tulip
See how systems of apps enable agile and connected operations.