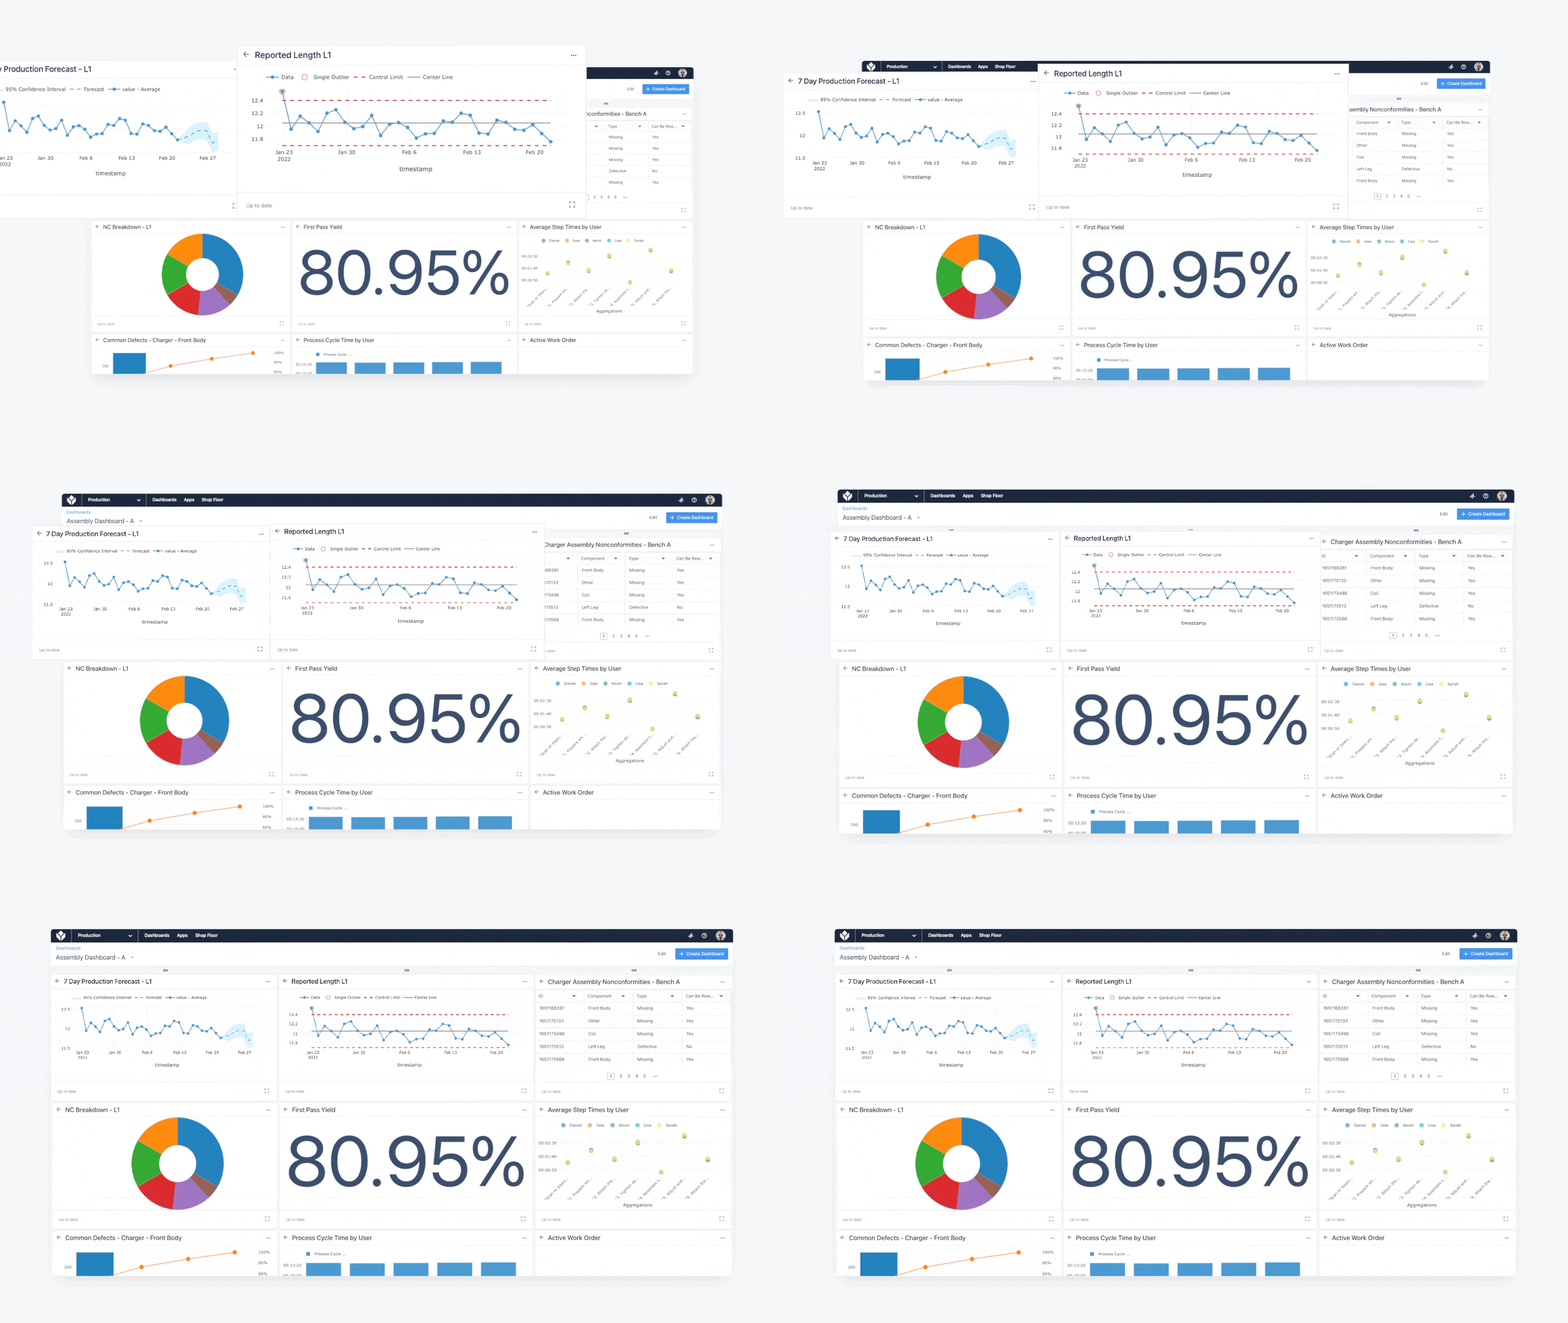
Tulip is a tool for decision-makers at all levels to get a pulse on their operations. Analytics is an important part of understanding the data coming out of your processes. We are introducing Analytics Insights to ensure that engineers, operators, and decision-makers have the data they need to support their decision-making in production environments. Analytics Insights are a collection of features in Tulip that leverage frontline knowledge and machine learning to enable outlier detection, accessible forecasting, and alerting.
These features lower the barrier of entry for creating meaningful insights beyond data visualization and deploying machine learning to the frontline.
What are Insights?
Analytics Insights are new capabilities within the platform that provide more data to users than just visualization. The first Analytics Insights available to users are Layers. Layers can be added to existing time series charts. They allow engineers to draw conclusions quickly and reduce the need for external BI tools and data processing steps by providing advanced machine learning in a platform built for operations. Tulip is the first platform built for frontline operations to offer these capabilities without the need for any code.
Control Charts
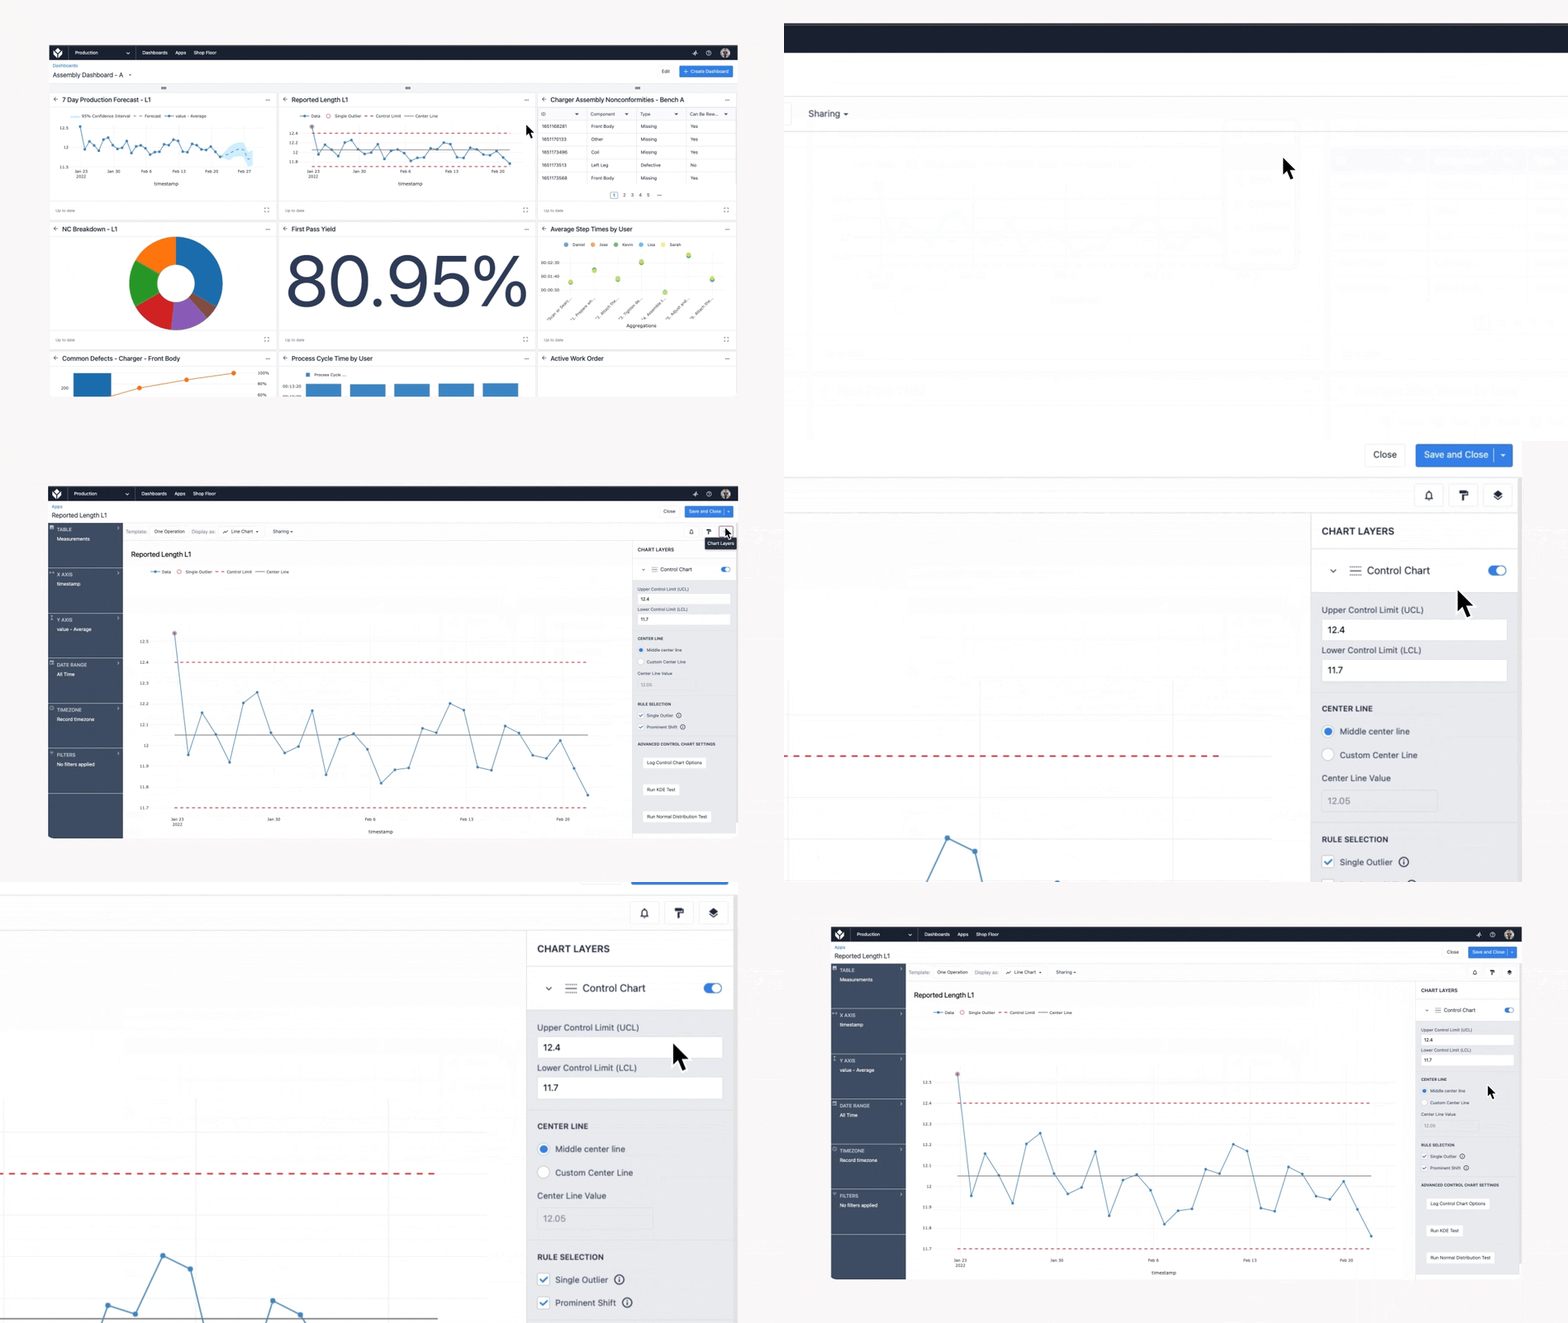
With the Control Chart Layer, engineers can identify outliers and prominent shifts in production. To configure the control chart, users can enter control chart limits.
In the next few months, the Control Chart Layer will be updated with an automatic limit calculation option that uses machine learning to streamline outlier detection.
Alerts
One-click alerts can be set up, to monitor out-of-control processes based on Control Chart data. Tulip will check automatically check data and notify select users if outliers are detected.
Forecasts
Another Layer that is now available in Analytics is the Forecast layer. The Forecast Layer uses machine learning to identify trends in production data. Timeseries data like cycle time, production rates, and part, defect, or event counts, can be used in Forecasts. Discover problems before they occur, as shifts and trends are visualized.
Forecasts work with one click but can be further configured to reflect seasonality, schedule patterns, and parameters for estimation without any coding required. Tulip’s no-code interface gives engineers power over their data and brings machine learning to their toolbox, without any extra data processing steps.
Real-time data, actionable insights
Tulip enables you to derive actionable insights from your data and integrate them into your daily operations without requiring a data scientist or any external BI tool.
These Analytics Insights features are available now for all Tulip customers. Analytics Insights can be used on table-based, time-series data in Tulip. The Tulip team will bring Insights into machine data over the next few months.
New features in Analytics will continue to arrive to create a new, powerful analytics experience. In addition to more alerting and machine learning features across the platform, users will soon see a new charting experience for enhanced data visualization.
| Who can use these features? |
|---|
| Users on any plan can use these features. |
| Analytics Insights can be used in Analytics and Embedded Analytics with time series, Table-based data. Insights and alerts for machine data are coming soon. |

